Weka thread I have found that questions are answered very promptly and there is a lot of activity at the site, so you don't have to wait a long time to get a response. In addition there are some great books put out by Ian Witten and Eibe Frank that guide you through the practical data mining with a minimal barrage of mathematical theory:
Data Mining Practical Machine Learning Tools and Techniques With Java Implementations I have the first edition and have found it an immensely useful reference.
There are a variety of built in learning modules included in the free utility (Weka), such as linear regression, neural networks (a.k.a multilayer perceptrons), decision trees, support vector machines, and even genetic algorithms.
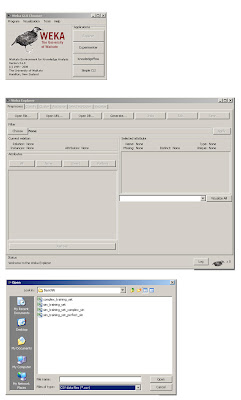
Fig 1. Using the Weka Gui
In Fig 1., we see the Weka GUI Chooser has been opened and the Explorer option was selected. The native format that Weka commonly uses is the .ARFF format, fortunately for us, however, it also reads in .CSV files, which are easily created with a save option in excel. The excel file we will first train is sim_training_set_perfect_sin.csv. Once loaded, you will see all of the relevant variables in the Weka Explorer shell.
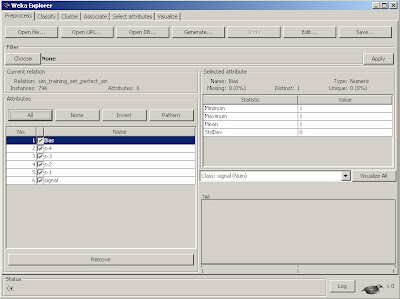
Fig 2. Loaded Excel csv training source file for Weka
We notice some new variables have been introduced that were not in part 1.
To understand why, let's show the CSV file that is used here.
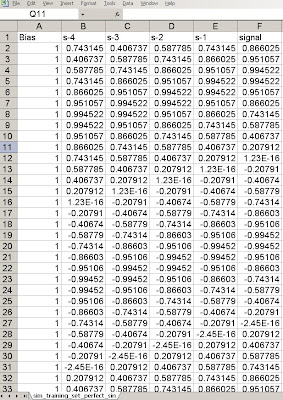
Fig 3. Training set variables.
What we see is that the original perfect sine wave signal has been preserved in the column labeled signal. The additional signals, s-1, s-2, s-3, s-4 are often called delayed or embedded (dimension) variables. They are simply lagged values of the signal that are used to train the neural network. There is no exact method to determine the number of lagged values, although a number of different methods exist. For now, we will simply accept that four delayed values of the signal are useful. The last column, called bias, is common to neural networks. The bias node allows the neural network to shift the constant signal input to the network via training. For instance, imagine our signal had an average of 2.0 but we were learning it. The neural network needs to have some input that will track that constant value or it will have large offset errors that will obstruct convergence. The bias node accomplishes that operation. Those familiar with Engineering theory will recognize this node as a DC bias.
Ok, so once other thing we notice in the GUI interface is the Class:signal(num) is selected on the bottom right. This is because we are predicting a numerical class, rather than a nominal one (which is the typical default for classification schemes).
Next, we select the classify tab to select our learning scheme, which in this case will be the MultilayerPerceptron.
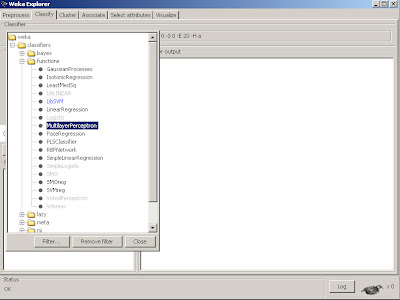
We then want to make sure certain options are selected.
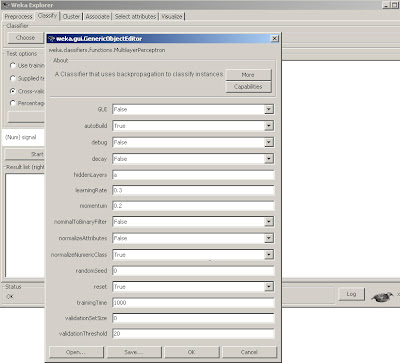
We set nominalToBinaryFilter and normalize attributes as False, as we don't wish to modify the input data to be binary and are not using nominal attributes. However, we
want the normalizeNumericClass set to True as mentioned earlier, it will force the normalization scheme to be set to Weka's internal limiting range, so we don't have to. Also, we will train for 1000 epochs.
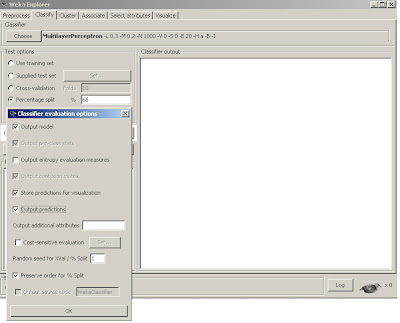
Fig 6. Preferences for MLP training model.
We will build a model by training on 66% of the data. We want to store and output the predictions so that we can visually see what they look like. Lastly, we will Preserve order for split as it allows us to display the predicted out of sample time series in the original order. With all of these features set, we simply click OK and the start button and it will quickly build our first Neural Network model!
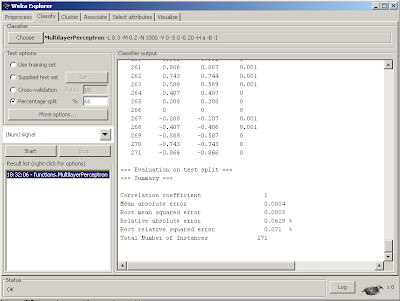
Fig 7. Results with summary of statistics console.
If we scroll up we can see the actual weights that the model converged upon for our Multilayer Perceptron that will be used to predict the out of sample data.
We can see that there is a nice printout of the last 34% of results (271 out of sample data points) along with the predicted value and error, as well as a useful summary of statistics in the bottom of the console. We often use Root mean squared error as a performance metric for neural net regressions. In this case, the number .0005 is quite good. But let's use a little trick to get a visual inspection of just how good. We can actually grab the data from the console (by selecting it with the left mouse button and dragging), then copy this data back into excel. As a result, we can then plot the actual versus predicted out of sample results inside of excel.
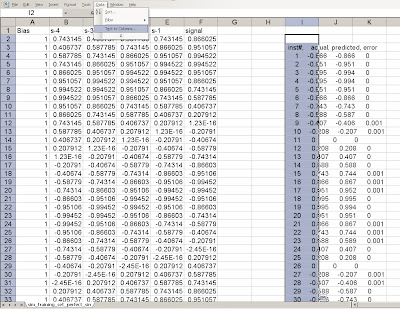
Fig 8. Importing prediction results back into Excel.
Notice that we cut and paste the data from the Weka console back into Excel, but must select text to columns in order to separate the data back into columns.
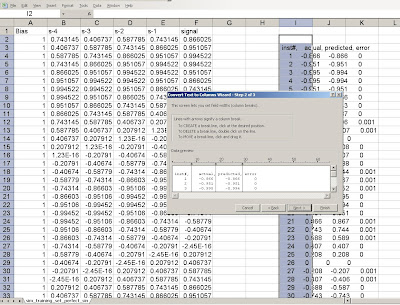
Fig 9. Selecting the regions to separate as columns.
And tada! We can now plot the predicted vs. actual values. And look how nicely they line up. The errors are extremely small on the out of sample set, notice some are 0, others are .001, imperceptible to the eye, without zooming way in on that point.
It actually found a perfect model for this time series (we will expand a bit later why), and the errors can be attributed to numerical precision.
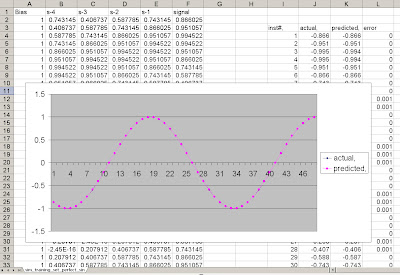
Fig 10. Resulting plot of predicted vs. actual data.
We have now just built a basic Neural Network with a simple sine wave time series using Weka and Excel. The predicted out of sample results were extremely good.
However, as we will see, the data signal we used, the simple sine wave is a very easy signal to learn as it is perfectly repetitive and stationary. We will see that as the signal gets increasingly complex, the prediction results do not work as well.
That's it for Part 2, comments are welcome.

good information plz i want to write about how to make an adata set in excel before enter it to the weka plz write article about that
ReplyDeletejust how can prepare bias based on what formula you make the data as this form
ReplyDeletein fig 3 thanks alot
Hi baraa,
ReplyDeleteThe way to create a bias signal is simply to create a column in excel called bias and fill it with ones
(for the complete length of your signal). The neural net will find the proper bias value after training!
hi i understood what you mentioned thanks but another prob that the csv file when i save the sheet in csv format and open it in weka it opened but the attributes in format just appeared like one attribute like
ReplyDeletebias;s-4;s-3;s-2;s-1;signal
not as 6 attributes
bias
s-4
s-3
s-2
s-1
signal
why?
baraa,
ReplyDeletePlease send me the csv file @ intelligenttradingtech@yahoo.com. As long as you saved it as a .csv file that should not be happening. One more thing is to make certain that when you open it in Weka, you open as a .csv file as well.
hi again i entered comments but may not appear on your site i donot know why , there is aproblem faced me about the values i saw that your waves in graph very good cause you enter the value like 1.23E-16 and -2.50E-16 i have avalue but how can i enter this formulas, means based on what , i want to analyse bank sector for 10 compnies with 385 data set i do every step but this formulas faced me tell me where should i put these formulas and thank you very much
ReplyDeletebara,
ReplyDeleteAs I mentioned in earlier emails to you, I really think you need to get a basic excel book as well as some grounding in trigonometry, as it's a bit difficult to walk through each of the basic steps to get you there.
I also need to try to provide the files in the future, as it would simplify the tutorials.
IT
no just why you enter this values 1.23E-16 AND -2.50E-16 means based on what
ReplyDeleteplz tell me i will not ask you again just this the last q
bara, those values are just numerical rounding values that represent the value 0. Try not to focus to much on exactness (I gave the exact equations in an earlier reply signal=sin(2pifo/fs),
ReplyDeletefs =1/Ts where Ts is the interval or difference between column row values. Focus more on getting a simple sine wave signal into excel.
Hi there,
ReplyDeleteI'm having problems opening .CVS in WEKA, getting error ".cvs not regognized as ab .CVS data files file".
I just saved my signals column as .CVS (comma delimited) is that right? What what exactly has to be saved as .CVS ?
Some help would be nice, THANK YOU!
Mario,
ReplyDeleteInside of excel, when you save your spreadsheet of time series values to learn (as shown in tutorial),
make sure to save the file as CSV (Comma Delimited) under choices, not cvs or xls).
Also, occasionally it might complain if it doesn't like the format for some reason. Try to avoid labels and make sure it is raw numbers in general format to see if you can get it to work.
Hi, I'm having a few problems or maybe I'm just misunderstanding something, here is what I like to do: I'm trying to forecast the next five DAX stock changes where the data from the past year will be used as training set, so I basically just want the 5 next values. Is that possible with this model? Thank you very much!
ReplyDeleteAlthough it is possible, the general default for Weka is only 1 output. You can ask on the nabble Weka thread how to enable multivariate output predictions, or I'm afraid you'll have to find a suitable language to write your own multivariate output NN architecture.
ReplyDeleteAn alternative method would be to simple use the inputs and train one variable output for each input set. I.e. train a net for 1 day pred for past year. Then train another net for 2 day prediction, etc. This approach is more cumbersome and less efficient, however.
OK, I undstand now. Lets say I'd like to predict the next value for this shinewave model, following your instructions I got a lot of predicted values like in fig7. So how to configure weka to show just the next predicted value (how to get an predition interval of 1 day).
ReplyDeleteThank you!
Leon, the example for figure seven was set up with a 66^ split on training and test data. The 33% of out of sample data is a one day ahead prediction.
ReplyDeleteThe results in fig 7 were captured and pasted into excel to show the actual vs. predicted data for the 1 day look forward value. All of the examples posted follow this methodology.
Thanks very much. Perfect introduction.
ReplyDeleteJoe Kwiatkowski
Hello, great post!
ReplyDeleteI’m having some trouble with Weka.
I have a normal CSV file with 2 attributes (Index, Value).
Index,Value
1,2
2,4
3,6
4,8
…….
Weka can read the file without problem but it doesn’t create automatically the “delayed or embedded (dimension) variables”, only 2 attributes are visible.
How can I create the delayed variables (Value-1, Value-2….)?
Thanks
Claudio
Hi,
ReplyDeleteWhen I ran this tutorial, I manually cut and pasted the columns over in excel. Just take the target variable and copy one row down, and paste over, two down, etc... and crop the top or bottom extras.
However, you can automatically do it in VBA, if you have familiarity, or any other common program.
Cheers,
IT
very useful information
ReplyDeleteThanks farha.
ReplyDeleteIT
Hi,
ReplyDeleteI am doing a project on neural networks.I am just in the initial phase. so that i dont know much about it. but i would like know more about how we will get the values of s-4 s-3 s-2 s-1 and signal and what does each represents.can just give me brief idea about it
Gela,
ReplyDeleteThe values of s-4 ..s-1 are called embedded delay attributes. They are delayed or prior versions of the current signal value, signal.
You can just cut and paste parts of signal down for each column.
I.e. if signal column has
and current value is 6 with column history of 3,4,5,6 then s-1 would be 3,4,5
s-2 3,4 and so on. Because you will have unused values at the top, just cut those rows out.
Good Luck,
IT